
Learn Python for Data Analysis and Visualization 
This course provides an introduction to the Python Pandas library, a powerful tool for data analysis and manipulation. It covers topics such as data structures, data manipulation, data visualization, and more. Learners will gain the skills necessary to work with data in Python and become proficient in data analysis and visualization. ▼
ADVERTISEMENT
Course Feature
![]() Cost:
Cost:
Free Trial
![]() Provider:
Provider:
Skillshare
![]() Certificate:
Certificate:
Paid Certification
![]() Language:
Language:
English
![]() Start Date:
Start Date:
On-Demand
Course Overview
❗The content presented here is sourced directly from Skillshare platform. For comprehensive course details, including enrollment information, simply click on the 'Go to class' link on our website.
Updated in [March 06th, 2023]
Learners can learn a variety of skills from this course, Learn Python for Data Analysis and Visualization. This course will teach learners how to use Anaconda, the world's leading data science platform, to set up Python and manage libraries. Learners will also learn how to install and set up the free Atom Text Editor, create virtual environments, clone a GitHub repository directly into Atom, create new code branches in GitHub and Atom, install the Pandas library, use Pandas DataFrames for data analysis, quickly and efficiently inspect large data files, use conditional filtering to refine data, use NumPy and Pandas together, create DataFrames without starting data files, create DataFrames from dictionaries, use broadcasting to create DataFrames, correctly label data within DataFrames, cleanse data files for easier analysis, create graph plots from data (line, bar, scatter, area and more), save and export data files for sharing, use statistical exploratory data analysis techniques such as min, max, mean on data, manage date and time data within large data sets, create Date/Time indexes, partial string indexing, resampling techniques such as downsampling, method chaining, and more. This course is ideal for those with some Python programming experience, and all code and datasets used in this course are available to download for free from GitHub.
[Applications]
Upon completion of this course, learners can apply the knowledge gained to analyze and visualize data in Python. They can use the Anaconda platform to set up Python and manage libraries, as well as use the Atom Text Editor to clone a GitHub repository. Learners can also use Pandas DataFrames for data analysis, create DataFrames from dictionaries, and use broadcasting to create DataFrames. Additionally, learners can create graph plots from their data, save and export data files, and use statistical exploratory data analysis techniques. Finally, learners can manage date and time data within large data sets, create Date/Time indexes, and use resampling techniques such as downsampling.
[Career Paths]
Recommended career paths for learners of this course include:
1. Data Analyst: Data Analysts use data to identify trends and patterns, and then use this information to make decisions and recommendations. They are responsible for collecting, cleaning, and analyzing data, and then presenting their findings in a clear and concise manner. Data Analysts are in high demand, and the demand is only increasing as more organizations rely on data-driven decision making.
2. Data Scientist: Data Scientists use data to solve complex problems and develop new insights. They use a variety of techniques, such as machine learning, natural language processing, and statistical analysis, to uncover hidden patterns and trends in data. Data Scientists are in high demand, and the demand is only increasing as more organizations rely on data-driven decision making.
3. Data Visualization Specialist: Data Visualization Specialists use data to create visual representations of data, such as charts, graphs, and maps. They are responsible for creating visually appealing and informative visualizations that help people understand complex data. Data Visualization Specialists are in high demand, and the demand is only increasing as more organizations rely on data-driven decision making.
4. Machine Learning Engineer: Machine Learning Engineers use data to develop and deploy machine learning models. They are responsible for building, testing, and deploying machine learning models that can be used to make predictions and decisions. Machine Learning Engineers are in high demand, and the demand is only increasing as more organizations rely on data-driven decision making.
[Education Paths]
Recommended degree paths:
1. Bachelor of Science in Data Science: This degree path provides students with a comprehensive understanding of data science principles and techniques, including data analysis, machine learning, and data visualization. Students will learn how to use Python and other programming languages to analyze and interpret data, as well as develop strategies for data-driven decision making. The degree also covers topics such as data mining, predictive analytics, and artificial intelligence. This degree is becoming increasingly popular as businesses and organizations recognize the value of data-driven decision making.
2. Master of Science in Data Science: This degree path provides students with an advanced understanding of data science principles and techniques. Students will learn how to use Python and other programming languages to analyze and interpret data, as well as develop strategies for data-driven decision making. The degree also covers topics such as data mining, predictive analytics, and artificial intelligence. This degree is becoming increasingly popular as businesses and organizations recognize the value of data-driven decision making.
3. Master of Science in Business Analytics: This degree path provides students with an understanding of the principles and techniques of business analytics. Students will learn how to use Python and other programming languages to analyze and interpret data, as well as develop strategies for data-driven decision making. The degree also covers topics such as data mining, predictive analytics, and artificial intelligence. This degree is becoming increasingly popular as businesses and organizations recognize the value of data-driven decision making.
4. Doctor of Philosophy in Data Science: This degree path provides students with an in-depth understanding of data science principles and techniques. Students will learn how to use Python and other programming languages to analyze and interpret data, as well as develop strategies for data-driven decision making. The degree also covers topics such as data mining, predictive analytics, and artificial intelligence. This degree is becoming increasingly popular as businesses and organizations recognize the value of data-driven decision making.
Pros & Cons

Amazing class

Simplified working with pandas

Clear verbal instructions

Text in teacher's code editor too small

Zooming didn't help
Course Provider

Provider Skillshare's Stats at AZClass
Discussion and Reviews
0.0 (Based on 0 reviews)
Explore Similar Online Courses
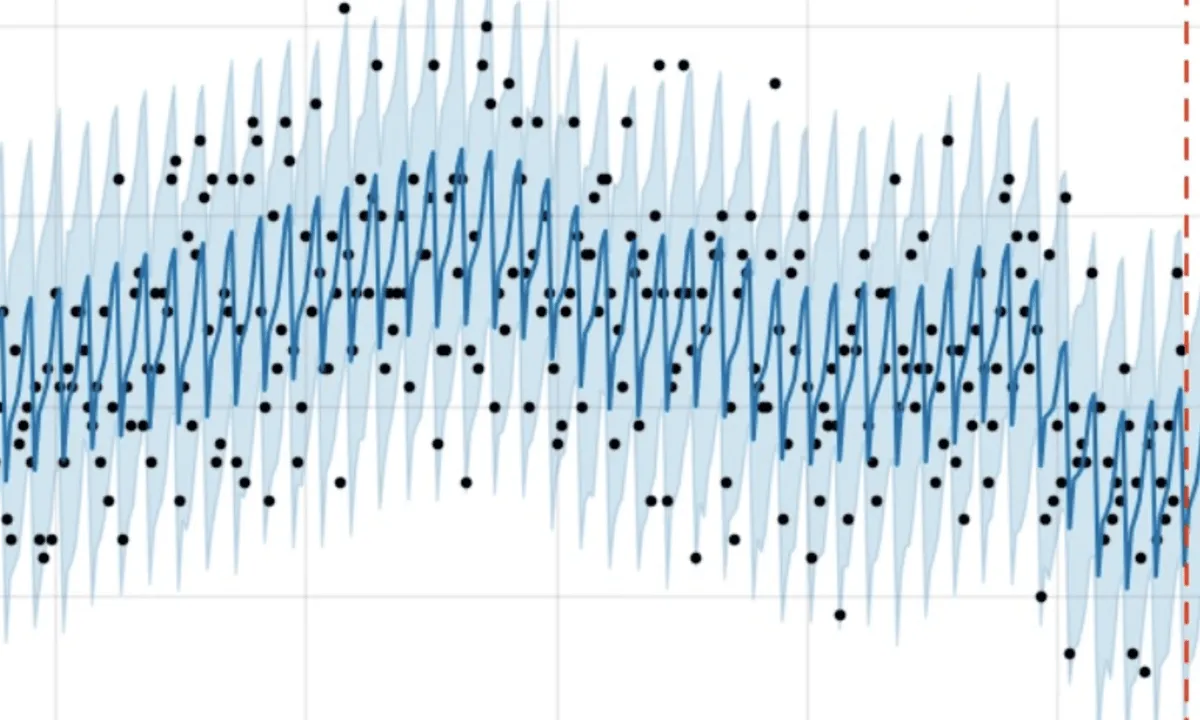
Intro to Time Series Analysis in R

Lean Product Portfolios: Beyond Value Stream Mapping

RDBMS PostgreSQL

Intro To PostgreSQL Databases With PgAdmin For Beginners

PostgreSQL: Client Applications

Mastering SQL using Postgresql

Database Design and Basic SQL in PostgreSQL

PostgreSQL: Advanced Queries
Spatial SQL with Postgres : A language for geographers

Learn SQL Using PostgreSQL: From Zero to Hero

PostgreSQL Essential Training

Start your review of Learn Python for Data Analysis and Visualization