Excel 2013 Essential Training 
This course provides an introduction to Excel 2013, covering topics such as data entry, functions, charting, and PivotTables. Learners will gain the skills necessary to effectively use Excel 2013 for data organization and analysis. ▼
ADVERTISEMENT
Course Feature
![]() Cost:
Cost:
Free Trial
![]() Provider:
Provider:
LinkedIn Learning
![]() Certificate:
Certificate:
No Information
![]() Language:
Language:
English
![]() Start Date:
Start Date:
Self Paced
Course Overview
❗The content presented here is sourced directly from LinkedIn Learning platform. For comprehensive course details, including enrollment information, simply click on the 'Go to class' link on our website.
Updated in [March 01st, 2023]
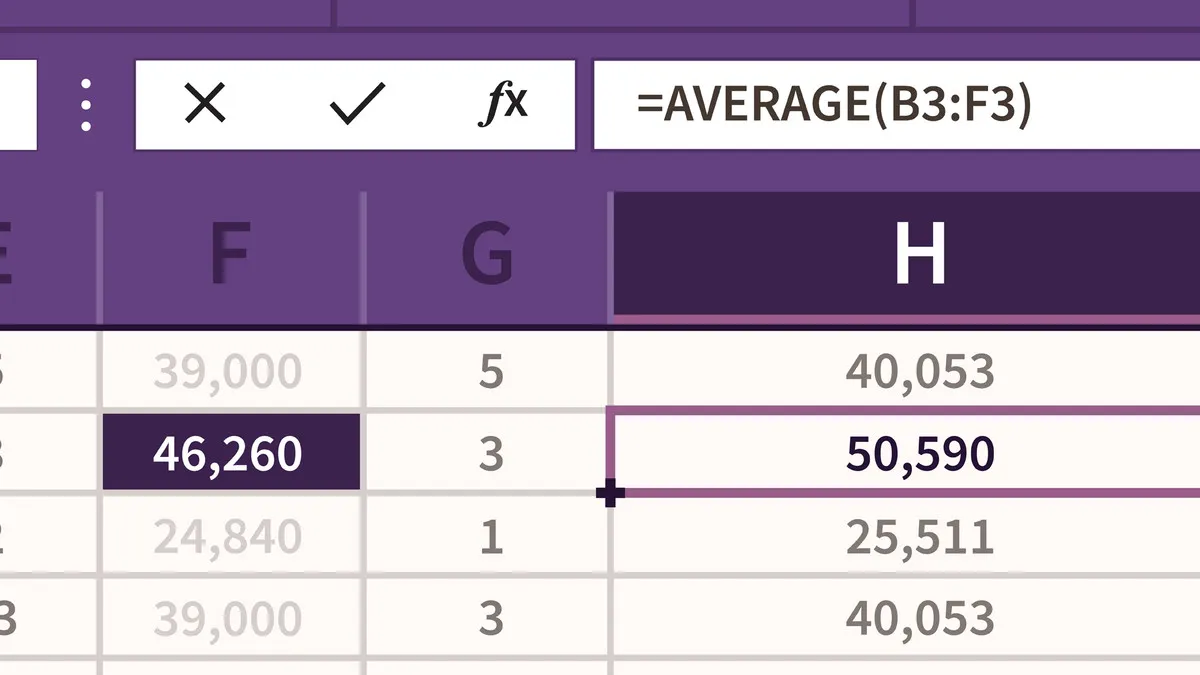
This Excel 2013 Essential Training course provides an overview of the essential features of Excel 2013. Participants will learn how to enter and organize data, perform calculations with simple functions, work with multiple worksheets, format the appearance of their data, and build charts and PivotTables. By the end of the course, participants will have a better understanding of how to use Excel 2013 to create and manage spreadsheets.
[Applications]
After completing this course, users can apply their knowledge of Excel 2013 to create and manage spreadsheets, analyze data, and create charts and PivotTables. They can also use the program to automate tasks, create macros, and collaborate with others. Additionally, users can use Excel 2013 to create and manage databases, create and manage forms, and use advanced functions and formulas.
[Career Paths]
1. Data Analyst: Data Analysts are responsible for collecting, organizing, and analyzing data to help inform business decisions. They use a variety of tools, such as Excel, to analyze data and create reports. With the increasing availability of data, the demand for Data Analysts is growing rapidly.
2. Business Intelligence Analyst: Business Intelligence Analysts use data to help organizations make better decisions. They use Excel to analyze data and create reports that help organizations understand their performance and identify areas for improvement.
3. Financial Analyst: Financial Analysts use Excel to analyze financial data and create reports that help organizations make informed decisions about investments and other financial matters. They use Excel to create financial models and analyze data to identify trends and make predictions.
4. Data Scientist: Data Scientists use Excel to analyze large datasets and uncover insights. They use a variety of tools, such as Excel, to analyze data and create reports that help organizations make better decisions. With the increasing availability of data, the demand for Data Scientists is growing rapidly.
[Education Paths]
1. Bachelor of Science in Computer Science: This degree path provides students with a comprehensive understanding of computer science fundamentals, including programming, software engineering, and computer architecture. Students will also learn about the latest trends in computer technology, such as artificial intelligence, machine learning, and cloud computing.
2. Bachelor of Science in Information Technology: This degree path focuses on the application of technology to solve business problems. Students will learn about the design and implementation of computer systems, networks, and databases, as well as the development of software applications.
3. Master of Science in Data Science: This degree path provides students with the skills to analyze and interpret large datasets. Students will learn about data mining, machine learning, and predictive analytics, as well as the use of statistical methods and programming languages to analyze data.
4. Master of Science in Business Analytics: This degree path focuses on the application of data science to business problems. Students will learn about the use of data to inform decision-making, as well as the development of predictive models and algorithms to optimize business processes.
Course Syllabus
Introduction
Using the exercise files
Course Provider

Provider LinkedIn Learning's Stats at AZClass
Discussion and Reviews
0.0 (Based on 0 reviews)
Explore Similar Online Courses

Machine Learning for Time Series Data in Python

Learning Reactjs

Python for Informatics: Exploring Information

Social Network Analysis

Introduction to Systematic Review and Meta-Analysis

The Analytics Edge

DCO042 - Python For Informatics

Causal Diagrams: Draw Your Assumptions Before Your Conclusions

Whole genome sequencing of bacterial genomes - tools and applications

How to Make Money with Excel Right Now - Work from Home incl FREE Training

Microsoft Excel Tutorial for Beginners Excel Training FREE Online Excel course

Data Visualisation: Charting Dashboards and Pivot Tables
 Related Categories
 Popular Providers
Quiz
 Submitted Sucessfully
1. What is the main purpose of Excel 2013?
2. What is the most important feature of Excel 2013?
3. What type of data can Excel 2013 help you organize?
4. Which of the following is a feature of Excel 2013?
5. What is the main purpose of Excel 2013 Essential Training?
Correct Answer: To learn how to enter and organize data, perform calculations with simple functions, work with multiple worksheets, format the appearance of your data, and build charts and PivotTables.


Start your review of Excel 2013 Essential Training