Dashboarding and Deployment 
This course provides an overview of analytical dashboarding, from best practices for design to deployment and publishing of visualizations. Participants will gain an understanding of advanced visualization techniques and create a capstone project to compare financial market movements to economic data. ▼
ADVERTISEMENT
Course Feature
![]() Cost:
Cost:
Free
![]() Provider:
Provider:
Coursera
![]() Certificate:
Certificate:
Paid Certification
![]() Language:
Language:
English
![]() Start Date:
Start Date:
22nd May, 2023
Course Overview
❗The content presented here is sourced directly from Coursera platform. For comprehensive course details, including enrollment information, simply click on the 'Go to class' link on our website.
Updated in [March 06th, 2023]
1. You will gain an understanding of best practices for designing a dashboard, creating a unified analytical environment, and deploying and publishing visualizations.
2. You will learn advanced visualization techniques and be able to apply them to create an information layout of the biggest gainers and losers in the financial markets.
3. You will be able to compare the movements of the financial markets to economic data.
4. You will develop a capstone project that will demonstrate your understanding of the concepts learned in the course.
5. You will gain the skills to create and deploy analytical dashboards that can be used to make informed decisions.
Course Provider

Provider Coursera's Stats at AZClass
Discussion and Reviews
0.0 (Based on 0 reviews)
Explore Similar Online Courses

Python API for Trading

Spatial SQL with Postgres : A language for geographers

Python for Informatics: Exploring Information

Social Network Analysis

Introduction to Systematic Review and Meta-Analysis

The Analytics Edge

DCO042 - Python For Informatics

Causal Diagrams: Draw Your Assumptions Before Your Conclusions

Whole genome sequencing of bacterial genomes - tools and applications

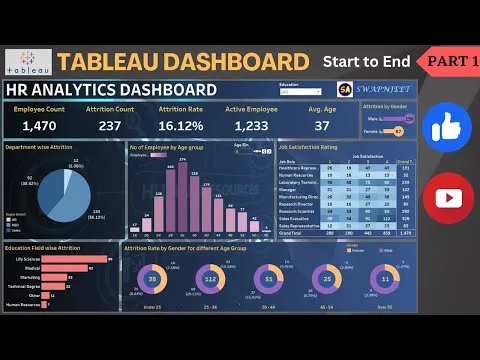
Tableau Dashboard from Start to End (Part 1) HR Dashboard Beginner to Pro Tableau Project

Tableau 10 for Data Scientists


Start your review of Dashboarding and Deployment