

Free Tableau Tutorial - Learn Tableau Desktop for Accurate Business Analysis 
Learn the fundamentals of Tableau Desktop with this free tutorial. Gain the skills needed to accurately analyze business data and capitalize on one of the fastest growing job markets in IT. ▼
ADVERTISEMENT
Course Feature
![]() Cost:
Cost:
Free
![]() Provider:
Provider:
Udemy
![]() Certificate:
Certificate:
No Information
![]() Language:
Language:
English
![]() Start Date:
Start Date:
Self Paced
Course Overview
❗The content presented here is sourced directly from Udemy platform. For comprehensive course details, including enrollment information, simply click on the 'Go to class' link on our website.
Updated in [April 29th, 2023]
This free Tableau Tutorial is designed to help you learn Tableau Desktop for accurate business analysis. Tableau Desktop is a powerful data visualization tool that enables users to quickly and easily create interactive visualizations and dashboards.
In this tutorial, you will learn how to create a new workbook and connect it to a new data source. You will also learn how to use the various chart types available in Tableau Desktop, such as Bar & Line Charts, Pie Charts, Geographic Maps, Scatter Plots, Groups, Area Charts, Filters, Dual Axis Charts, Crosstabs and Calculations, and Actions.
You will also learn how to use Tableau Desktop to create interactive visualizations and dashboards. You will learn how to use filters, parameters, and calculations to create dynamic visualizations. You will also learn how to share your work on a variety of venues, such as Tableau Public, Tableau Server, and Tableau Online.
At the end of this tutorial, you will have a better understanding of Tableau Desktop and be able to create accurate business analysis. You will be able to create interactive visualizations and dashboards that can be shared with colleagues and customers.
[Applications]
The application of this course can be seen in the ability to create accurate business analysis with Tableau Desktop. After completing this course, users should be able to create a new workbook and connect it to a new data source, as well as demonstrate each of the core competencies listed. Additionally, users should be able to create a variety of chart types, such as bar & line charts, pie charts, geographic maps, scatter plots, groups, area charts, filters, dual axis charts, crosstabs and calculations, and actions. Finally, users should be able to share their work on a variety of venues.
[Career Paths]
1. Business Intelligence Analyst: Business Intelligence Analysts use Tableau to analyze data and create visualizations to help businesses make better decisions. They are responsible for creating dashboards, reports, and other visualizations to help businesses understand their data. They also need to be able to interpret the data and provide insights to the business. As businesses become more data-driven, the demand for Business Intelligence Analysts is increasing.
2. Data Scientist: Data Scientists use Tableau to analyze large datasets and uncover patterns and trends. They use Tableau to create visualizations to help businesses understand their data and make better decisions. Data Scientists need to be able to interpret the data and provide insights to the business. As businesses become more data-driven, the demand for Data Scientists is increasing.
3. Data Visualization Designer: Data Visualization Designers use Tableau to create visualizations that help businesses understand their data. They need to be able to interpret the data and create visualizations that are both visually appealing and informative. As businesses become more data-driven, the demand for Data Visualization Designers is increasing.
4. Data Analyst: Data Analysts use Tableau to analyze data and create visualizations to help businesses make better decisions. They need to be able to interpret the data and provide insights to the business. As businesses become more data-driven, the demand for Data Analysts is increasing.
[Education Paths]
1. Bachelor of Science in Business Analytics: This degree path focuses on the application of data analysis and predictive modeling to solve business problems. It covers topics such as data mining, machine learning, and artificial intelligence. Students learn to use software such as Tableau to analyze data and create visualizations. This degree is becoming increasingly popular as businesses look to leverage data to make better decisions.
2. Master of Science in Data Science: This degree path focuses on the application of data science to solve complex problems. It covers topics such as data mining, machine learning, and artificial intelligence. Students learn to use software such as Tableau to analyze data and create visualizations. This degree is becoming increasingly popular as businesses look to leverage data to make better decisions.
3. Master of Science in Business Analytics: This degree path focuses on the application of data analysis and predictive modeling to solve business problems. It covers topics such as data mining, machine learning, and artificial intelligence. Students learn to use software such as Tableau to analyze data and create visualizations. This degree is becoming increasingly popular as businesses look to leverage data to make better decisions.
4. Master of Science in Data Visualization: This degree path focuses on the application of data visualization to solve complex problems. It covers topics such as data mining, machine learning, and artificial intelligence. Students learn to use software such as Tableau to analyze data and create visualizations. This degree is becoming increasingly popular as businesses look to leverage data to make better decisions.
Pros & Cons

Great for beginners
Easy to understand
Learnt a lot of useful things
Detailed content
Videos not too long
CSV files to learn with
Good match for beginners
Very helpful for work

Small screen
No advanced content
Course Provider

Provider Udemy's Stats at AZClass
Discussion and Reviews
0.0 (Based on 0 reviews)
Explore Similar Online Courses

Python : Basics you should learn for beginners

IT Fundamentals for Business Professionals: Enterprise Systems

Python for Informatics: Exploring Information

Social Network Analysis

Introduction to Systematic Review and Meta-Analysis

The Analytics Edge

DCO042 - Python For Informatics

Causal Diagrams: Draw Your Assumptions Before Your Conclusions

Whole genome sequencing of bacterial genomes - tools and applications
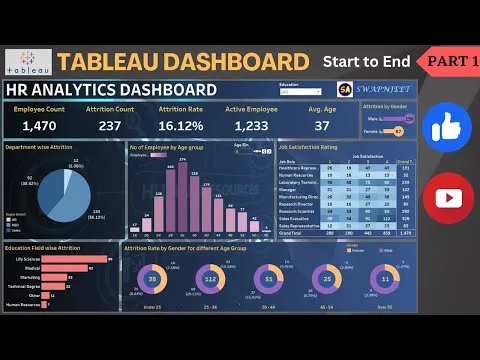
Tableau Dashboard from Start to End (Part 1) HR Dashboard Beginner to Pro Tableau Project
Tableau 10 for Data Scientists

Tour the Tableau Environment
 Related Categories
 Popular Providers
Quiz
 Submitted Sucessfully
1. What is Tableau Desktop?
2. What type of charts can be created with Tableau Desktop?
3. Where can you share your work created with Tableau Desktop?
4. What type of chart types are available in Tableau Desktop?
Correct Answer: Bar & Line Charts, Pie Charts, Geographic Maps, Scatter Plots, Groups, Area Charts, Filters, Dual Axis Charts, Crosstabs and Calculations, and Actions

Start your review of Free Tableau Tutorial - Learn Tableau Desktop for Accurate Business Analysis