Tableau 2018 Advanced: Master Tableau in Data Science 
This online course will teach you how to use Tableau 2018 to its full potential. You will learn how to create and use Groups and Sets, control Sets with Parameters, create highly interactive Dashboards, use Table Calculations as filters, and perform Data Mining in Tableau. You will also gain an understanding of Level Of Details, Quick Table calculations, and Advanced Mapping Techniques. By the end of the course, you will have a comprehensive knowledge of Tableau 2018. ▼
ADVERTISEMENT
Course Feature
![]() Cost:
Cost:
Paid
![]() Provider:
Provider:
Udemy
![]() Certificate:
Certificate:
No Information
![]() Language:
Language:
English
![]() Start Date:
Start Date:
Self Paced
Course Overview
❗The content presented here is sourced directly from Udemy platform. For comprehensive course details, including enrollment information, simply click on the 'Go to class' link on our website.
Updated in [April 24th, 2023]
This course provides an in-depth look at Tableau 2018 Advanced, a powerful data visualization tool. It is designed to help students develop an intrinsic understanding of how Tableau works and how to use it to create highly interactive dashboards.
The course begins with an introduction to Groups and Sets, and how to create and use them. Students will learn the difference between Groups and Sets, and how to create and use Static Sets and Dynamic Sets. They will also learn how to combine Sets into more Sets, and how to use Sets as filters.
Next, students will learn how to create Sets via Formulas, and how to control Sets with Parameters. They will also learn how to control Reference Lines with Parameters, and how to use multiple fields in the colour property.
The course then moves on to Dashboards, and how to create highly interactive Dashboards. Students will learn how to develop an intrinsic understanding of how Table calculations work, and how to use Quick Table calculations and write their own Table calculations. They will also learn how to combine multiple layers of Table Calculations, and how to use Table Calculations as filters.
The course then covers trendlines, and how to use them to interrogate data. Students will learn how to perform Data Mining in Tableau, and how to implement Advanced Mapping Techniques. Finally, they will learn about Level Of Details.
By the end of the course, students will have a comprehensive understanding of Tableau 2018 Advanced and how to use it to create highly interactive dashboards. They will be able to use Groups and Sets, create Sets via Formulas, control Sets with Parameters, use multiple fields in the colour property, and use trendlines to interrogate data. They will also be able to perform Data Mining in Tableau, implement Advanced Mapping Techniques, and understand Level Of Details.
[Applications]
Those who have completed the Tableau 2018 Advanced: Master Tableau in Data Science course can apply their knowledge to create interactive dashboards, perform data mining, and implement advanced mapping techniques. They can also use groups, sets, and table calculations to filter and interrogate data, as well as use parameters to control reference lines. Additionally, they can use multiple fields in the colour property and create highly interactive dashboards.
[Career Paths]
1. Data Scientist: Data Scientists use Tableau to analyze large datasets and uncover trends and insights. They use Tableau to create visualizations and dashboards to communicate their findings. As data science becomes more important in the business world, the demand for Data Scientists with Tableau experience is increasing.
2. Business Intelligence Analyst: Business Intelligence Analysts use Tableau to create interactive dashboards and reports to help organizations make better decisions. They use Tableau to analyze data and identify trends and patterns. As organizations become more data-driven, the demand for Business Intelligence Analysts with Tableau experience is increasing.
3. Data Visualization Designer: Data Visualization Designers use Tableau to create visually appealing and informative visualizations. They use Tableau to create interactive dashboards and reports that help organizations make better decisions. As organizations become more data-driven, the demand for Data Visualization Designers with Tableau experience is increasing.
4. Tableau Developer: Tableau Developers use Tableau to create custom applications and dashboards. They use Tableau to create interactive dashboards and reports that help organizations make better decisions. As organizations become more data-driven, the demand for Tableau Developers with Tableau experience is increasing.
[Education Paths]
1. Bachelor of Science in Data Science: This degree path focuses on the development of skills in data analysis, data mining, machine learning, and other related areas. It also covers topics such as statistics, mathematics, and computer science. This degree path is becoming increasingly popular as businesses and organizations are relying more and more on data-driven decisions.
2. Master of Science in Business Analytics: This degree path focuses on the application of data science and analytics to business problems. It covers topics such as data mining, machine learning, predictive analytics, and data visualization. This degree path is becoming increasingly popular as businesses and organizations are looking for ways to make better decisions based on data.
3. Master of Science in Artificial Intelligence: This degree path focuses on the development of skills in artificial intelligence, machine learning, and other related areas. It covers topics such as robotics, natural language processing, and computer vision. This degree path is becoming increasingly popular as businesses and organizations are looking for ways to automate processes and make decisions based on data.
4. Doctor of Philosophy in Data Science: This degree path focuses on the development of advanced skills in data science, machine learning, and other related areas. It covers topics such as data mining, predictive analytics, and data visualization. This degree path is becoming increasingly popular as businesses and organizations are looking for ways to make better decisions based on data.
Pros & Cons

BEST of the BEST!

Excellent course

Great Experience

Worth the time and money

Enhances knowledge and skill set

Opens up possibilities

Clear and concise lessons

Lacks practical training

Few lessons on writing expressions
Course Provider

Provider Udemy's Stats at AZClass
Discussion and Reviews
0.0 (Based on 0 reviews)
Explore Similar Online Courses

Swords and Shovels: Game Managers Loaders and the Game Loop

Beginner Weight Lifting: Upper&Lower Body Split Training

Python for Informatics: Exploring Information

Social Network Analysis

Introduction to Systematic Review and Meta-Analysis
The Analytics Edge

DCO042 - Python For Informatics

Causal Diagrams: Draw Your Assumptions Before Your Conclusions
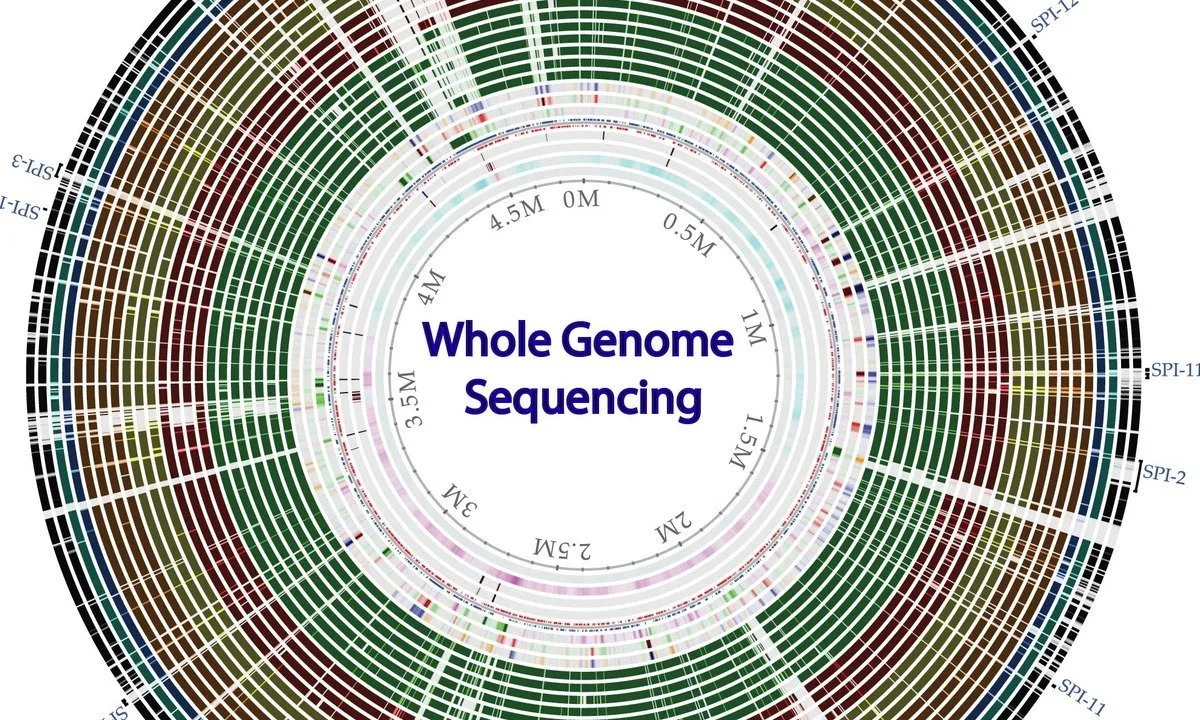
Whole genome sequencing of bacterial genomes - tools and applications
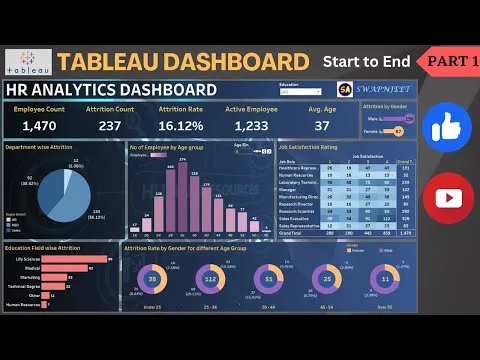
Tableau Dashboard from Start to End (Part 1) HR Dashboard Beginner to Pro Tableau Project

Tableau 10 for Data Scientists

Tour the Tableau Environment
 Related Categories
 Popular Providers
 Popular Searches
Quiz
 Submitted Sucessfully
1. What is the difference between Groups and Sets?
2. What is Level Of Details?
3. What is Quick Table Calculations?


Start your review of Tableau 2018 Advanced: Master Tableau in Data Science