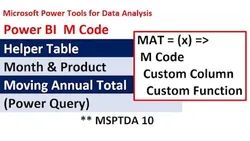
MSPTDA 10: Power BI M Code for Moving Annual Total (MAT): Custom Function Power Query Custom Column 
This video provides an introduction to the Moving Annual Total (MAT) calculation in Power BI, using a custom function created by Bill Szysz. It demonstrates how to use Power Query and a custom column to transform data models and calculate the MAT. The video is inspired by a comment from YouTube and provides a step-by-step guide to the process. ▼
ADVERTISEMENT
Course Feature
![]() Cost:
Cost:
Free
![]() Provider:
Provider:
Youtube
![]() Certificate:
Certificate:
Paid Certification
![]() Language:
Language:
English
![]() Start Date:
Start Date:
On-Demand
Course Overview
❗The content presented here is sourced directly from Youtube platform. For comprehensive course details, including enrollment information, simply click on the 'Go to class' link on our website.
Updated in [February 21st, 2023]
This course provides an overview of how to use Power BI M Code for Moving Annual Total (MAT) and Custom Function Power Query Custom Column. It begins with an introduction and a comment from YouTube that inspired the video. It then provides a verbal description of the data model transformation, including the Moving Annual Total Calculation. It then thanks Bill Szysz for the Custom Function. It then provides an Excel example of Moving Annual Total. It then explains why Power Query is used instead of Excel or DAX. It then looks at the final solution and Custom Function to see what is being attempted, including a method to filter a table within a Custom Column in Another Table and have the formula see criteria from the Inner Table and the Outer Table.
The course then provides step-by-step instructions on how to import files, extract a sorted unique list from the source Facet Table, create a Crossjoin of all combinations of Months and Product Names, group by Date and Product to get Monthly Totals, create a final table, sort in Power Query, use the Table.Buffer Function to prevent a call to the source table for every row in the table, and create a Custom Column with a Function to Calculate Moving Annual Totals (MAT). It then adds new data to test if everything updates and provides a summary.
[Applications]
The application of this course is to provide an understanding of how to use Power BI M Code for Moving Annual Total (MAT) and Custom Function Power Query Custom Column. After completing this course, users will be able to use the techniques learned to create a Crossjoin of all combinations of Months and Product Names, Group BY Date and Product to get Monthly Totals, Merge Step 3 and Step 4, Remove Nulls, Add Custom Column to get One Year Back, Sort in Power Query, and use Table.Buffer Function to Buffer the Internal Table to prevent a call to the source table for every row in the table. Additionally, users will be able to create a Custom Column with Function to Calculate Moving Annual Totals (MAT). Finally, users will be able to add new data to test if everything updates.
[Career Paths]
1. Business Intelligence Analyst: Business intelligence analysts use data to help organizations make better decisions. They use a variety of tools, such as Power BI, to analyze data and create reports and dashboards. They also develop data models and create data visualizations to help organizations understand their data. The demand for business intelligence analysts is growing as organizations become more data-driven.
2. Data Scientist: Data scientists use data to solve complex problems and uncover insights. They use a variety of tools, such as Power BI, to analyze data and create predictive models. They also develop algorithms and use machine learning to uncover patterns in data. The demand for data scientists is growing as organizations become more data-driven.
3. Data Engineer: Data engineers are responsible for designing, building, and maintaining data pipelines. They use a variety of tools, such as Power BI, to create data pipelines that can ingest, process, and store data. They also develop data models and create data visualizations to help organizations understand their data. The demand for data engineers is growing as organizations become more data-driven.
4. Data Analyst: Data analysts use data to uncover insights and solve problems. They use a variety of tools, such as Power BI, to analyze data and create reports and dashboards. They also develop data models and create data visualizations to help organizations understand their data. The demand for data analysts is growing as organizations become more data-driven.
[Education Paths]
1. Bachelor's Degree in Business Analytics: This degree program focuses on the use of data and analytics to make informed business decisions. It covers topics such as data mining, predictive analytics, data visualization, and machine learning. Students learn how to use data to identify trends, develop strategies, and optimize operations. This degree is becoming increasingly popular as businesses recognize the value of data-driven decision making.
2. Master's Degree in Data Science: This degree program focuses on the use of data to solve complex problems. It covers topics such as data mining, machine learning, artificial intelligence, and data visualization. Students learn how to use data to identify patterns, develop models, and make predictions. This degree is becoming increasingly popular as businesses recognize the value of data-driven decision making.
3. Doctoral Degree in Artificial Intelligence: This degree program focuses on the use of artificial intelligence to solve complex problems. It covers topics such as machine learning, natural language processing, and computer vision. Students learn how to use AI to identify patterns, develop models, and make predictions. This degree is becoming increasingly popular as businesses recognize the value of AI-driven decision making.
4. Master's Degree in Business Intelligence: This degree program focuses on the use of data and analytics to make informed business decisions. It covers topics such as data mining, predictive analytics, data visualization, and machine learning. Students learn how to use data to identify trends, develop strategies, and optimize operations. This degree is becoming increasingly popular as businesses recognize the value of data-driven decision making.
Course Provider

Provider Youtube's Stats at AZClass
Discussion and Reviews
0.0 (Based on 0 reviews)
Explore Similar Online Courses

Interior Design Basics

Academic Writing Essentials

Python for Informatics: Exploring Information

Social Network Analysis

Introduction to Systematic Review and Meta-Analysis

The Analytics Edge

DCO042 - Python For Informatics

Causal Diagrams: Draw Your Assumptions Before Your Conclusions

Whole genome sequencing of bacterial genomes - tools and applications

Microsoft Power Platform
![Microsoft Power BI : A-Z of Power BI in 90 Minutes : 2023 [Updated]](/ccsimg/td_book/check/c3335b84f65d0fc9166ae7cb130df533.webp)
Microsoft Power BI : A-Z of Power BI in 90 Minutes : 2023 [Updated]


Start your review of MSPTDA 10: Power BI M Code for Moving Annual Total (MAT): Custom Function Power Query Custom Column