
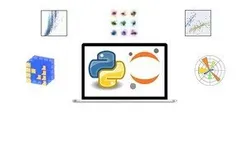
Pandas & Seaborn Data Science & Visualization course 
This Pandas & Seaborn Data Science & Visualization course is the most comprehensive course on Udemy to learn Data Science with Python 3. It covers topics from basics of Scientific Python Ecosystem, NumPy Fundamentals, Advanced Data Visualization, Data Acquisition Techniques, Linear Algebra and Matrices, and more. With over 105 lectures and 15.5 hours of video, this course will help you become a Master in Data Acquisition and Visualization with Python 3 and acquire employers' one of the most requested skills of 21st Century. Enroll now and start your journey to become a Data Science Professional! ▼
ADVERTISEMENT
Course Feature
![]() Cost:
Cost:
Paid
![]() Provider:
Provider:
Udemy
![]() Certificate:
Certificate:
Paid Certification
![]() Language:
Language:
English
![]() Start Date:
Start Date:
On-Demand
Course Overview
❗The content presented here is sourced directly from Udemy platform. For comprehensive course details, including enrollment information, simply click on the 'Go to class' link on our website.
Updated in [August 31st, 2023]
Skills and Knowledge:
- Understanding of the Scientific Python Ecosystem
- Knowledge of Data Science, Pandas, and Altair
- Basics of NumPy Fundamentals
- Advanced Data Visualization
- Data Acquisition Techniques
- Linear Algebra and Matrices
- Installation of Python 3 on Windows
- Setting up Raspberry Pi
- Tour of Python 3 environment on Raspberry Pi
- Jupyter installation and basics
- NumPy Ndarrays
- Array Creation Routines
- Basic Visualization with Matplotlib
- Ndarray Manipulation
- Random Array Generation
- Bitwise Operations
- Statistical Functions
- Installation of SciPy and Pandas
- Linear Algebra with NumPy and SciPy
- Data Acquisition with Python 3
- MySQLand Python 3
- Data Acquisition with Pandas
- Basics of Seaborn
- Configuring Charts with Seaborn
- Multi-plot Grid
- Visualize Linear Relationships
- Multi Color Plot
- Visualizing the distribution of a dataset
Professional Growth:
This Pandas & Seaborn Data Science & Visualization course provides professionals with the skills and knowledge necessary to acquire data with NumPy and Pandas and visualize it with Matplotlib and Seaborn. Professionals will learn the basics of Scientific Python Ecosystem, Data Science, Pandas, and Altair, as well as advanced topics such as Data Acquisition Techniques, Linear Algebra and Matrices. This course will help professionals become a master in Data Acquisition and Visualization with Python 3, which is a highly sought-after skill in the 21st century. Professionals will gain the knowledge and skills necessary to advance their career and increase their knowledge in a fun and practical way.
Further Education:
This course is suitable for preparing for further education. It covers a wide range of topics related to data science, including data acquisition, data visualization, and linear algebra. It also provides practical examples and exercises to help you apply the concepts you learn. Additionally, the course offers lifetime access to the lectures, PDFs, and Jupyter notebooks, allowing you to review the material at any time.
Course Provider
Provider Udemy's Stats at AZClass
Discussion and Reviews
0.0 (Based on 0 reviews)
Explore Similar Online Courses

Ultimate Guide to Digital Sketching: Beginner to Advanced
CSS Layouts: From Float to Flexbox and Grid

Python for Informatics: Exploring Information

Social Network Analysis

Introduction to Systematic Review and Meta-Analysis
The Analytics Edge

DCO042 - Python For Informatics

Causal Diagrams: Draw Your Assumptions Before Your Conclusions
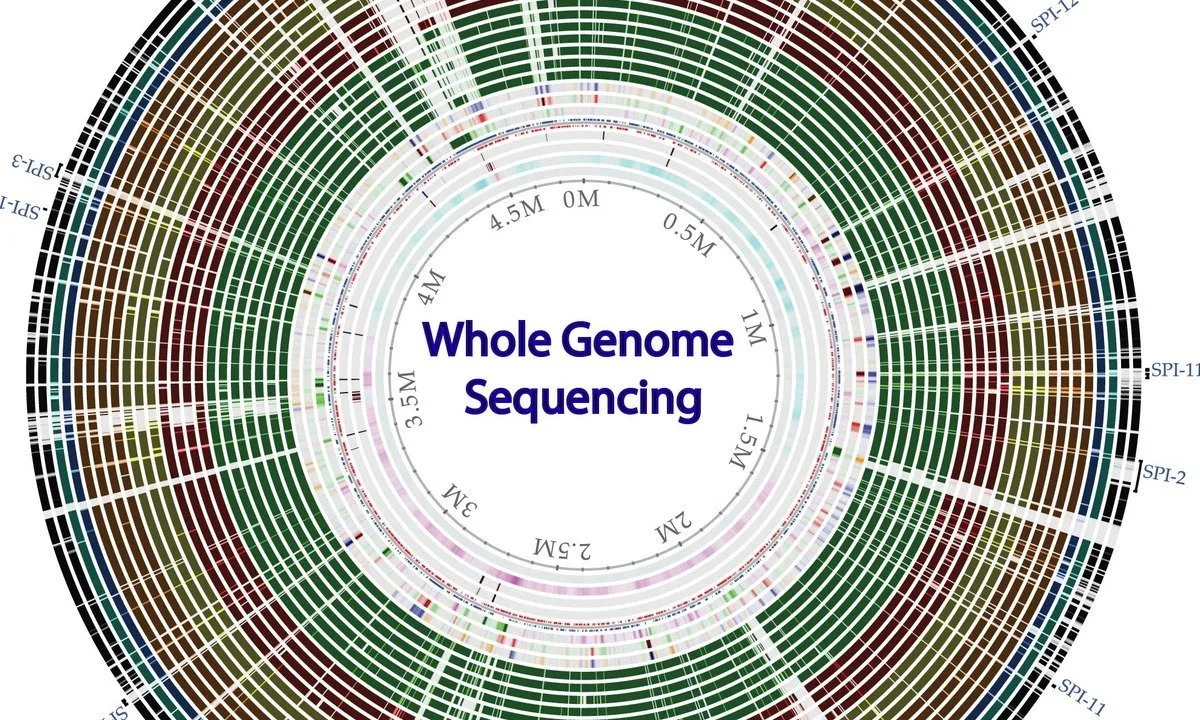
Whole genome sequencing of bacterial genomes - tools and applications

Augmented Data Visualization with Machine Learning

Data Visualization

Start your review of Pandas & Seaborn Data Science & Visualization course