SPSS for Beginners - Full Course 
This course provides a comprehensive introduction to SPSS for beginners. It covers the different versions, editions, and modules of SPSS, as well as how to take a look at sample data, create graph board templates, bar charts, histograms, scatterplots, frequencies, and descriptives. It also covers how to explore labels and definitions, entering data, importing data, hierarchical clustering, factor analysis, and regression. This course is a great way to get started with SPSS and learn the basics. ▼
ADVERTISEMENT
Course Feature
![]() Cost:
Cost:
Free
![]() Provider:
Provider:
freeCodeCamp
![]() Certificate:
Certificate:
Paid Certification
![]() Language:
Language:
English
![]() Start Date:
Start Date:
On-Demand
Course Overview
❗The content presented here is sourced directly from freeCodeCamp platform. For comprehensive course details, including enrollment information, simply click on the 'Go to class' link on our website.
Updated in [February 21st, 2023]
Unlock the Exciting World of Learning! Here's What Awaits You: With SPSS for Beginners - Full Course, learners can gain a comprehensive understanding of the SPSS software and its various versions, editions, and modules. They can explore the sample data, graph board templates, bar charts, histograms, scatterplots, frequencies, and descriptives. They can also learn how to enter data, import data, use hierarchical clustering, factor analysis, and regression. Finally, learners can gain insight into the next steps they can take to further their knowledge and skills. With this course, learners can gain the confidence and skills to use SPSS for their data analysis needs.
[Applications]
After completing this course, learners can apply their knowledge of SPSS for Beginners to analyze data, create graphs, and interpret results. They can use the software to create bar charts, histograms, scatterplots, and frequencies. They can also use the software to perform descriptive analysis, hierarchical clustering, factor analysis, and regression. Additionally, learners can use the software to enter data, import data, and create labels and definitions. Finally, learners can use the software to explore their data and take the next steps in their data analysis.
[Career Paths]
1. Data Analyst: Data analysts use SPSS to analyze data and create reports. They use the software to identify trends, develop insights, and make predictions. Data analysts are in high demand as businesses increasingly rely on data-driven decisions.
2. Market Research Analyst: Market research analysts use SPSS to analyze customer data and develop insights into consumer behavior. They use the software to identify target markets, develop marketing strategies, and measure the effectiveness of campaigns.
3. Business Intelligence Analyst: Business intelligence analysts use SPSS to analyze data and develop insights into business performance. They use the software to identify opportunities, develop strategies, and measure the success of initiatives.
4. Data Scientist: Data scientists use SPSS to analyze large datasets and develop insights into complex problems. They use the software to identify patterns, develop models, and make predictions. Data science is a rapidly growing field, and SPSS is an essential tool for data scientists.
Course Provider

Provider freeCodeCamp's Stats at AZClass
Discussion and Reviews
0.0 (Based on 0 reviews)
Explore Similar Online Courses
TensorFlow 20 Complete Course - Python Neural Networks for Beginners Tutorial

Kubernetes Essentials
Python for Informatics: Exploring Information

Social Network Analysis

Introduction to Systematic Review and Meta-Analysis
The Analytics Edge

DCO042 - Python For Informatics

Causal Diagrams: Draw Your Assumptions Before Your Conclusions
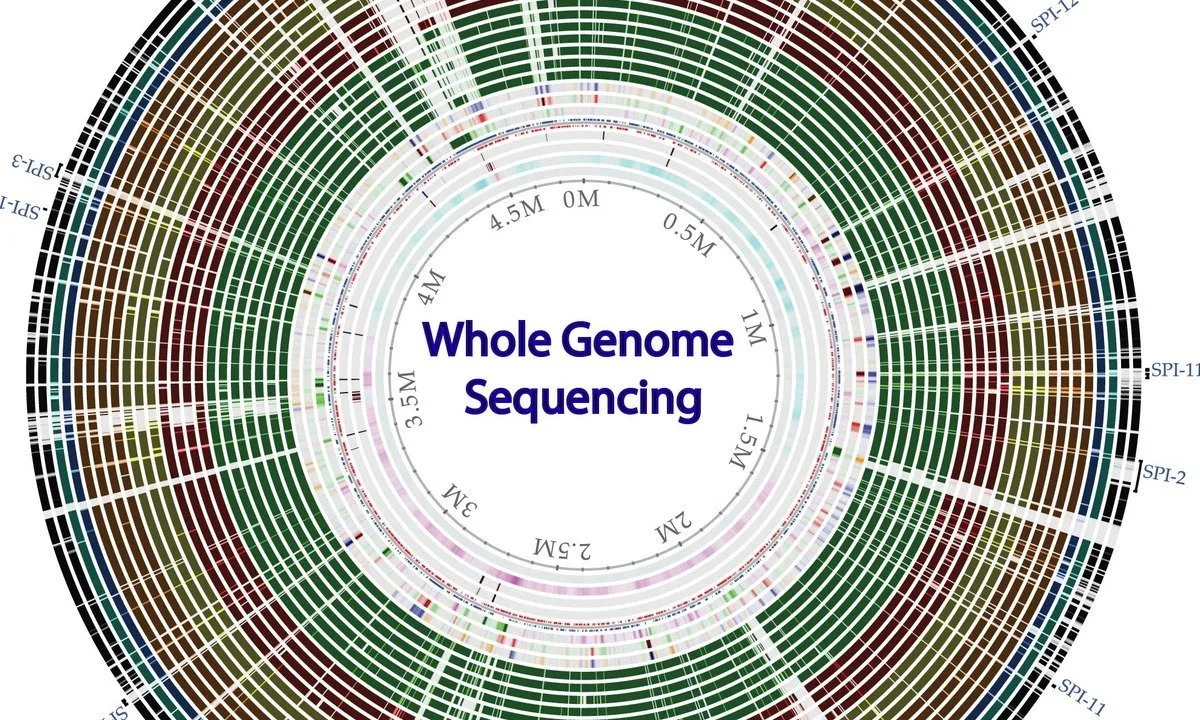
Whole genome sequencing of bacterial genomes - tools and applications
Non-Parametric Analysis

SPSS Masterclass: Learn SPSS From Scratch to Advanced

Start your review of SPSS for Beginners - Full Course